Using infographics for marketing has exploded in popularity over the past few years. They provide an effective way to simplify complex messages through the use of visual presentations.
The digital and social landscapes have drastically changed during the past decade, and the state of infographics has found itself at the forefront of many marketers agendas. According to a recent study, roughly 60% of businesses that were questioned had leveraged infographics for marketing purposes. 1 The report stated 74% of marketers use visual content to convey marketing messages on social media. Of those that had used infographics, nearly 85% found them to be effective.
Why Are Infographics Effective For Marketing Purposes?
Humans have shorter attention spans than ever before. With an effective infographic marketing strategy, brands are provided with a medium that quickly grabs the audience’s attention. And while consumers may readily forget what they read, they have a much better chance of remembering what they see. Infographics also work because they do a good job at evoking emotion thanks to their use of colors and images.
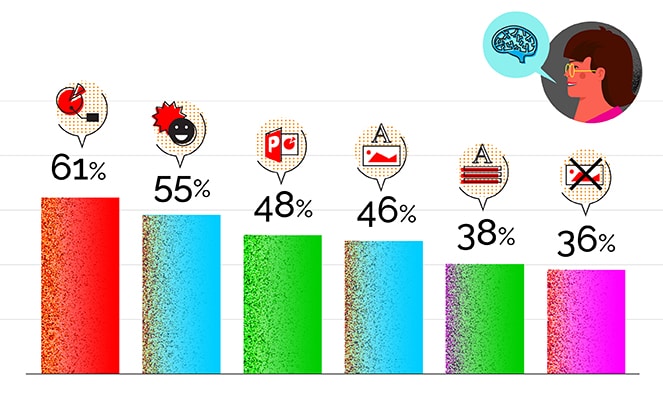
When compared to various forms of content types that impact learning and information retention, infographics come out on top. Infographics impact learning and information by 61% when compared to the following:
 How Are Consumers Viewing Infographics?
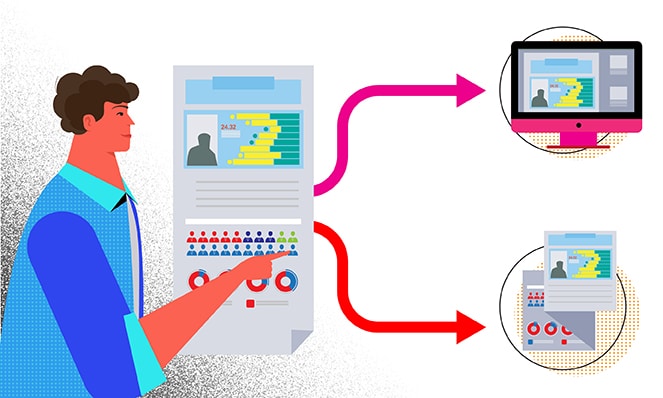
Although the majority of internet traffic stems from mobile devices, infographics are most commonly viewed from a desktop or laptop device making them important tools for digital marketing and social media. Why is this? It is believed that a primary contributor is found among the fact that most infographics are targeted at working professionals.
Also, it’s common sense that a good infographic or visual representation is much more appealing when viewed from a large screen, especially being that they are typically long and rectangular and it takes a lot of scrolling to view them.
How to Start Using Infographics for Marketing Collateral

There’s a lot that goes into creating an infographic, especially from a design standpoint. Only professional designers have the know-how and skill set that are required to deliver an infographic that clearly conveys the intended message.
Here’s a look at six ways to create your own infographics marketing strategy.
1. Pick a Topic
The first step in creating an infographic marketing strategy is to choose the topic you want to focus on. Ideally, you’ll end up focusing on multiple topics, creating an infographic for each topic.
Some topics may require that you create more than one infographic. Take for example you run a business that sells boots. You can create an infographic on certain brands of boots as well as ones on the top activities to be enjoyed while wearing boots. You could even create a great infographic about the benefits of wearing steel-toed boots when working in a factory.
To pick infographic topics that you want to focus on, you need to reference your customer persona and choose ones that your customers are most interested in and want to learn about.
An interesting topic that is always a good idea to focus on is how your industry has evolved throughout the years. Going back to the boots example, you could create an infographic that details how boots have changed over the past 1,000 years.
You’ll also want to complete research and see which topics are trending in your industry. Do keep in mind, however, that quality infographics take anywhere from four to eight weeks or longer to create. So, a topic that is trending now may not still be trending by the time you’re ready to publish the infographic. With this in mind, you’ll need to do your best to predict ahead of time which topics are going to be trending by the time you publish.
Another way to strategically pick topics for infographics is to revisit your old existing content. Using metrics and analytics, you can pinpoint which topics have garnered the most engagement; these are the topics you want to focus on when creating future infographic ideas.
You can go through old blog posts, ebooks, white papers, and more to determine which topics your audiences have shown the most interest in.
If you have already been using infographics as a marketing tool and certain ones have received positive feedback and high engagement rates, you should create subtopics based off of those. You can create new infographics based on those subtopics to provide more value to your audience.
The number one tip to remember when choosing a topic for an infographic is to steer clear of ones that are overly-promotional. If your goal is to create an infographic that focuses solely on your brand, you’re wasting your time, money, and resources. The goal of an infographic is to educate the audience on a topic, not a brand.
2. Always Use Credible Sources

There are a couple tricks you can follow to ensure you are pulling information for your infographics from credible sources.
Always conduct a search by tagging “site:gov or site:edu” to the end of your search term. Take for example you are doing an infographic on medical marijuana. When you search Google for information, make sure your search looks something like this: “history of medical marijuana site:gov”. This ensures that all search results are coming from credible, government-related websites.
You can also use this same trick to search for .org websites, but you’ll need to triple-check the information provided on these sites for credibility.
In addition to .gov and .edu sources of information, you should also consider tapping into survey data and sales reports as they provide interesting pieces of data that can be used to create your infographics.
If your budget is big enough, you should definitely hire a research team to perform the research for you. When partnering with a visual marketing agency, you’ll have a research team at your disposal.
Five websites that tend to be great resources for research information that you can use in your infographics are:
Any quotes that you use need to come from industry experts or those considered to be thought leaders. In fact, the more quotes you can provide, the better. The power of social proof should never be underestimated. Including several quotes throughout your infographics should always be a top priority as they boost credibility and add a sense of humanistic emotion.
3. Create the Content
Once you have chosen a topic and performed research, it’s now time to create the content that’s going to be included in the infographic. To ensure you are using infographics correctly for your content marketing purposes, you’ll need to have a professional writer create the content for you. Professional infographic design agencies have their own writers who can be of the utmost help during the content creation phase.
It’s always a good idea to make sure the infographic tells some type of story. Whether it be based on a true story or fictional, adding a story makes it easier for the audience to follow along as they view the infographic.
Without a story, an infographic will turn into a bunch of disconnected points of data. The audience will feel confused and overwhelmed with too much information.
Only the introduction, and possibly the conclusion, should be text-heavy. All other parts of the infographic should be light on text. More importantly, the information you share should be demonstrated in a visual manner. Whether it be graphs and charts or icons and images, the goal is to keep it as visual as possible.
4. It’s Time to Focus on Design
Another crucial element to using infographics for marketing is to focus much of the creation phase on design.
A lot of brands try to stuff too much information in an infographic, thus defeating the entire purpose, which is to present a message in a clear and easy-to-understand manner. With this in mind, don’t be afraid to use lots of empty space around each element. This ensures the audience can clearly differentiate one element from the next.
Instead of trying to stuff too much information in such a small amount of space, consider making the infographic longer. Your audience would much rather scroll down a page to view the entire infographic rather than being confused because there’s too much information in a small space.
5. Brand the Infographic

6. Distribution of the Infographic

When printing an infographic, this may limit the amount of information that can be displayed. You could consider creating two versions of the infographic — one for online and one for print.
There are lots of ways to distribute your infographics. For starters, you’ll want to create a landing page for each of them. This page needs to be optimized so that digital and social media platforms can feature your infographic, meaning it should include social sharing buttons, particularly for Facebook, Google+, Pinterest, and Twitter.
You’ll also want to submit the infographics to various infographic directories. This will ensure you are able to secure infographic backlinks, which is imperative to boost the SEO value of your infographics. When placing your pieces in these directories, always include a company introduction with each piece so that your brand awareness is spread through each directory that publishes your infographics.
The Takeaway

Use Infographics To Increase Leads Today
Source
- https://www.forbes.com/sites/cherylsnappconner/2017/10/19/the-data-is-in-infographics-are-growing-and-thriving-in-2017-and-beyond/#488aec08137c


 How Are Consumers Viewing Infographics?


