As a marketer, it’s important to use technology to your advantage. One such way to use it is by leveraging data dashboards for marketing purposes. Let’s take a close look at data dashboards, including what they are and how you can use them for marketing.
What Are Data Dashboards?

An EMC Digital Universe study says that by 2020, there will be 40 zettabytes of data in the digital landscape. That’s 40 trillion megabytes. With so much data, it only makes sense that marketers should use data dashboards. These dashboards can help you organize your data. More specifically, they provide a centralized location for monitoring, analyzing and extracting as needed.
When used strategically, you can use data dashboards much like a decision tree to create meaningful insights that drive your marketing decisions. Some of today’s more robust data dashboards display aggregated information according to beautiful and intuitive visuals and illustrations. You can even use these visuals as part of your marketing campaigns.
Why should you use visuals as part of your marketing campaigns? Because people love visuals. In fact, 32% of marketers say visual marketing is more important to them than blogging. 80% of marketers already use visual assets within their social media marketing campaigns while 51% of them prioritize the creation of visual assets over other forms of content marketing creation. The human brain is wired for visual learning. Think about it. If you look at a piece of paper with text and an image, what will you notice first? The visual, of course.
You can use data dashboards for all areas of your business. From different departments to tracking goals to analyzing processes, data dashboards give you a way to operate your company according to the utmost efficiency and effectiveness. When used correctly, these dashboards give you simple access to actionable analytics that have the potential to increase your bottom line.
If you don’t take advantage of data dashboards, you will find yourself having to sift through massive amounts of unstructured data. Even worse, many of your decisions are made on gut feelings rather than facts and hard data.
What Is the Primary Function of a Data Dashboard?
The primary function of any type of data dashboard is to take raw data and consolidate and structure it so that you can find meaningful answers to some of your most pertinent business questions. You can have all the data in the world, but when it’s unstructured, it will prove of little use. Ideally, you will link various data dashboards with specific KPIs that compliment your business goals. By drilling down into specific parts of your data and creating benchmarks, you can measure your growth and progress on a continual basis. As a result, you gain the ability to make data-driven decisions.
How Do Data Dashboards Work?

- What’s our quick ratio?
- What products are resulting in the most revenue?
- How many customer service calls have we handled this week?
- What social media channel is generating the most leads?
- Where is most of our web traffic coming from?
- What lead magnets are producing the best results?
- What does our marketing funnel look like?
- What type of people is our content reaching?
What Types of Visuals can You Create With Data Dashboards?
You already know that visual marketing works. However, the creation of visual assets can get quite expensive. And if you’re creating them yourself, they can also become extremely time-consuming. With data dashboards, you have a way to tap into visual assets in a fast, simple manner.
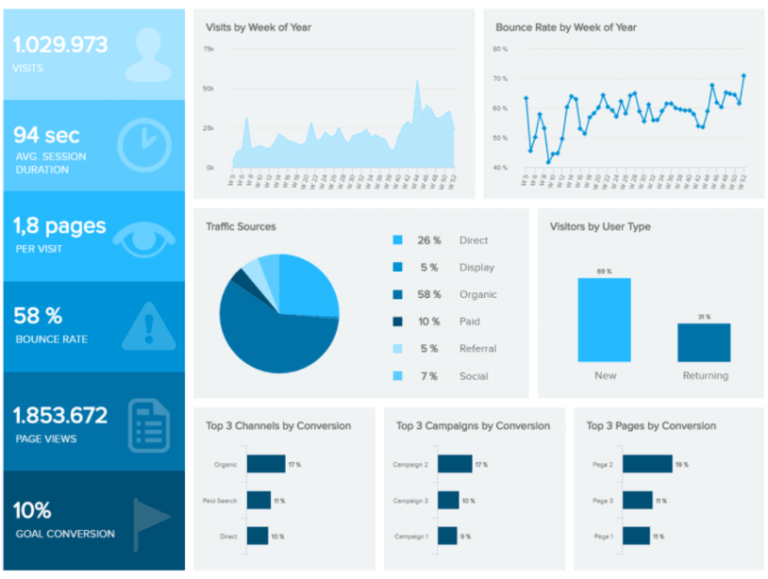
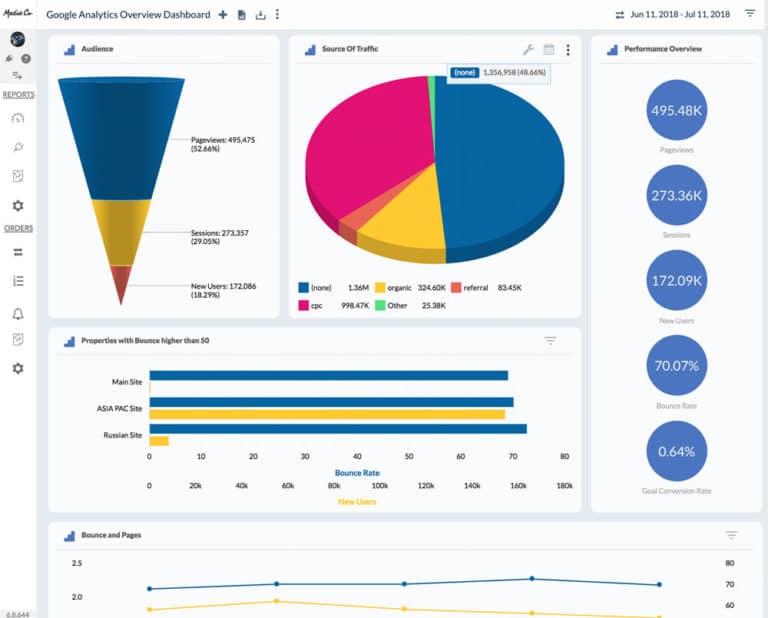
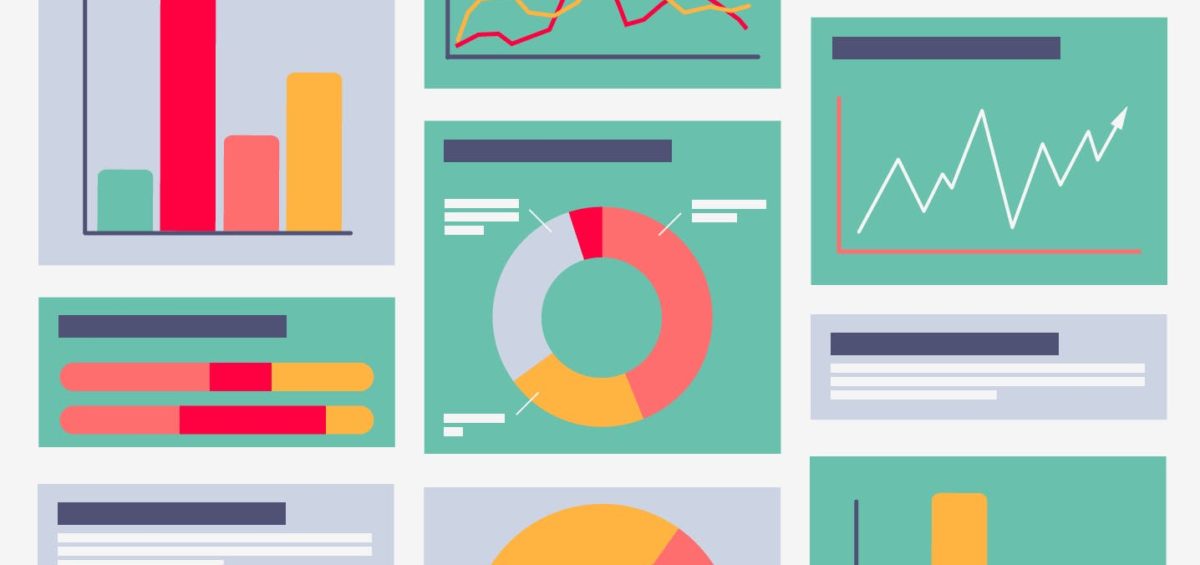
Data dashboards produce several types of visuals, including line charts, tables, graphs, pie charts, bar charts, and more. Imagine analyzing data and producing a gorgeous graph that highlights how customer satisfaction rates have skyrocketed during the past three months thanks to the creation of a YouTube channel. In an attempt to get more people to follow the channel, you make a social media post that includes the graph. The graph grabs the attention of your audience and drives traffic to your YouTube channel. As a result, this further increases customer satisfaction because more and more customers are viewing various product tutorials on your YouTube channel. Best of all, you didn’t have to outsource the creation of the graph. Instead, you used your own data and data dashboard as a source for visual assets.
How can Marketers Use Data Dashboards?
In addition to using data dashboards as a source for visual assets, you can use them to achieve other important marketing goals. They provide clear-cut guidance on just about any marketing decision while providing a sense of ownership over the information you need when you need it. When a CEO or stakeholder has a marketing-related question, you can turn to your data dashboards to get the answers you need. This allows you to provide immediate feedback, which is often crucial to landing sponsors and building trust with current stakeholders.
You can also use data dashboards to spot marketing trends, easily allowing you to refine your existing marketing practices to meet the demands of your audience.
Final Thoughts
When you’re in need of visual marketing assets, make sure to leverage your data dashboards. For help with any of your visual marketing needs, contact IGW today.


