See How Infographic Services Can Skyrocket Your SEO Today
With data being generated in record-breaking amounts, businesses are looking for ways to synthesize and utilize all the information coming their way. Infographics, taking advantage of both text and visual content, can be leveraged in innovative new ways. Expertly crafted visual content is easily consumed by viewers and can help increase awareness and productivity, as well as improve communication and understanding. Here is a great overview of infographic definition.
Following this deluge of data, came the rise of the infographic to help make sense of it all. Infographics are helping to make the plethora of data more digestible by combining the power of text and graphics. Using the most effective aspects of written and visual communication, the infographic, commonly used in Social Media and SEO, also goes beyond marketing. Explore ways to harness this tool and implement infographics in any business.
A DELUGE OF DATA
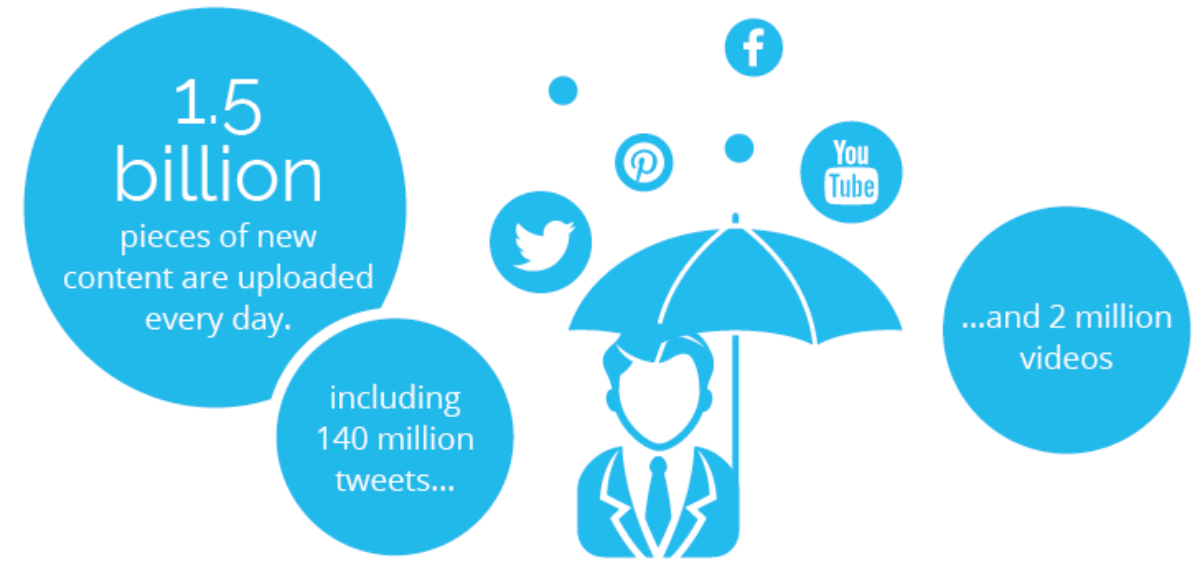
Massive amounts of data are created on a daily basis – 1.5 billion pieces of content that include 140 million tweets and 2 million videos. EVERY DAY.
The average person is exposed to 174 newspapers worth of information a day, which can often lead to an individual feeling overwhelmed or bombarded with more data than can be comprehended.
Speaking in a TED talk about the beauty of data visualization, writer and designer David McCandless suggested that infographics might provide a sense of relief from massive amount of data:
“There’s something almost quite magical about visual information. It’s effortless. It literally pours in. If you’re navigating a dense information jungle, coming across a beautiful graphic or lovely data visualization is a relief. It’s like coming across a clearing in the jungle.” – David McCandless, writer and designer in a TED talk on beauty of data visualization
THE RISE OF THE INFOGRAPHIC
Infographics are a type of visual shorthand utilizing colors, images, and design elements to communicate complex data in visual format.
This conversion of data into graphs, charts, maps, or visual stories – also known as “data visualization” or “information design,” has become an extremely popular way to present information in an easily digestible medium. Between 2010 and 2012 alone the search volume for infographics increased over 800%. In March 2012 #infographic was tweeted 56,765 times; at its peak it was tweeted 3,365 in 24 hours. Between April 2011 and April 2012 the search term “infographic” was searched 301,000 times and the term “infographics” was searched 246,000 times on average per month worldwide on Google. It is hardly surprising that infographics are becoming a key way that information is shared digitally. Graphics are an engaging way to help people quickly process the massive amounts of data being produced without having to read large amounts of text.
THE POWER OF TEXT AND GRAPHICS
Infographics take advantage of how information is processed and remembered by individual viewers. The human brain is engineered to seek out and process visual content. Over 90% of information transmitted to the brain is visual, which is processed 60,000 times faster in the brain than text (according to research by 3M Corporation).
Graphics, pictures, maps, charts – anything visual – is processed holistically while text requires a linear approach, as each letter is a symbol that fits into a pattern of a complete word. The word than fits into a larger sentence whose meaning needs to be deciphered. Visuals, however, are accessible and allow large amounts of information and meaning to be conveyed in novel and interesting packages. Visual information is more easily processed and thus better received – 40% of people have a better response to visual information over plain text.
Graphics do what text alone cannot, affecting people both cognitively and emotionally. Cognitively, graphics expedite and increase our level or communication, comprehension, recollection, and retention. Visual clues help to decode text and signal important information that should be noted. Emotionally, pictures enhance or affect emotions, engage our imagination and stimulate other areas of our brain, which leads to greater comprehension. Emotions also play an essential role in decision making, perception, and learning.
The real power of Infographics, however, is that they combined the strengths of both visual and textual information.
“On their own, text and graphics are both useful yet imperfect methods for communication. Written language allows an almost infinite number of word combinations that allow deep analysis of concepts but relies heavily on the reader’s ability to process that information. Graphics may be easier for the reader to understand but are less effective in communication of abstract and complicated concepts. … combining text and graphics allows communicators to take advantage of each medium’s strengths and diminish each medium’s weaknesses.” – Barbara M. Miller and Brooke Barnett, Newspaper Research Journal, Winter 2010
Infographics are compelling and attractive because people love facts, figures, statistics and graphics. Visual content is easily scanned by the eye, allowing a lot of information to be conveyed in a short period of time, helping copious or complex information be more accessible and digestible. Visual content also has viral capabilities – sharing photographs and other visual content on social media sites is the number one way to engage with fans and followers. Images make up more than one third of all links shared on Twitter. On Facebook photos generate twice as many ‘Likes’ as text updates and videos are shared 12 times more than links and text posts. 42% of all posts on Tumblr are photos and Pinterest generates more referral traffic than Twitter, Stumbleupon, LinkedIn and Google+ combined. Utilizing the visual format’s viral tendencies, infographics are portable or embeddable, automatically linking from a blogger’s or poster’s site to yours.
SOCIAL MEDIA AND SEO
Infographics are shareable, “likable,” and evergreen – or in other words – easily passed around on social media. They are permanent linkable content that retain relevancy for months following it’s original publishing. This viral quality can result in wider exposure and help with Google’s “Page Rank” algorithm. Editors will utilize interesting or compelling information from infographics, connecting industries that seem to have little natural linkage, helping your site to earn links from other markets. Journalists – always looking for numbers and statistics to incorporate in their writing – will also happily link back to your infographic when utilizing your stats.
Another great marketing aspect of infographics is the versatility of the research compiled. This information can go beyond the visual medium and can be utilized to create additional content such as a white paper, press release, or investigative piece. Creating additional in-bound marketing opportunities, infographics also offer quick measurable results. Social shares, backlinks, citations, and traffic are all things easily tracked, allowing SEOs to create comprehensive ROI reports.
BEYOND MARKETING: HOW TO UTILIZE THE INFOGRAPHIC
Internal Communication
Not just for marketing, Inforgraphics can be highly effective tools to communicate within an organization. Explaining new policies, procedures or even how the company operates, visual information has the ability to convey important information. An interesting visual can even go ‘viral’ within – being shared and discussed between employees. Infographics can even help inter-departmental communication because visuals are easier to digest and cross language barriers. Increased dialogue and comprehension across individuals and departments leads to embedded knowledge across the organization.
Employee Training, Internal Manuals, Team Building
Other uses of Infographics internally include employee training manuals and guides, reference tools for managers and training sessions and posters or signage in high traffic areas to remind employees of proper procedures or important policies. Illustrating goals, progress made, or the positive/negative performance results can help boost morale or encourage teamwork.
Decision Making
Visual elements can help people compare and make choices. Visuals can be used to compare lists, highlighting pros and cons, exposing data patterns and relationships and help employees analyze reports more effectively and efficiently. Infographics can be used to visualize strategic documents, reports, and plans. Simplifying a complex subject by illustrating a step by step process or presenting an overview instead of an in-depth analysis.
Recruiting Tool
A visual job posting can help an organization increase interest and exposure for not only a particular job opening in a point in time, but for the entire company as a whole as well. While summarizing the skill set of the ideal candidate, an infographic can convey information about an organization and its corporate culture.
Survey Data and Demonstrations
Visually representing synthesized data helps to highlight interesting facts and emphasize important findings. Infographics are a great way to simplify copious amounts of information and pinpoint the points of interest. Similarly, infographics are helpful for demonstrating how a product or process works – how it is used, how it is made, the process of delivery, etc.
Tradeshows (In Print)
Beyond the digital world, the infographic fits into the real world as well. Tradeshows, annual meetings, conventions, presentations, or anywhere you need eye-catching and captivating signage – infographics can visually introduce your organization to a large group.
Infographics can be used in new and exciting ways in any business and in any industry. Take advantage of the massive amounts of data generated each day by harnessing the power of text and graphics. Either externally or internally, infographics can be tailored to convey important and insightful information to a specific audience and increase understanding and comprehension of your message. Go beyond marketing and utilize the infographic to help your business educate, excite, and expand.
Ready to leverage infographics for your business?
Click here to get started








Leave a Comment