Marketing messages are a great way to share research findings. People love making purchasing decisions based on facts because it makes them feel more confident in their purchase.
But sharing facts and research findings can be boring, especially when you’re just spitting out a bunch of numbers.
Building a high-converting marketing campaign starts with getting your message to stick in the minds of your audience is to share it through visual storytelling, and there’s no better way to do this than through infographics.
Someone has a 30x higher chance of reading your content when it comes in the form of an infographic instead of a text-only article. And that’s the goal of your marketing research, right? To get your audience to read your content so you can convince them of your key takeaways?
Of course it is, which is exactly why you should leverage infographics to achieve higher conversions with your content marketing efforts.
Top Reasons Market Researchers Need Infographics
Infographics are a great visual asset for supporting just about any type of marketing campaign. You can use them to argue a theory or concept, display survey data, make comparisons, demonstrate the results of a study, raise awareness on an issue, and so much more.

1. The Brain Loves Visuals
The human brain has a high preference for visuals. Although we’ve been communicating with one another for close to 30,000 years, we’ve only been communicating through written words for about 3,700 years. It’s no wonder that our brains are wired to process visuals faster than text.
When you use visuals to highlight your research findings, you become a thought leader in the minds of your audience. Color visuals alone increase a person’s willingness to read your content by 80 percent.
When looking at a web page, the average person sees about only 20 percent of the text. Instead, their eyes gravitate toward the visuals.
With an infographic, instantly capture the attention of the audience. As long as you start out with an attention-grabbing headline and introduction, the audience will at least take a moment to decide whether they want to look at your infographic. With text-only content, you’re lucky if the audience even notices your headline.
2. Multiple Infographic Types to Choose From
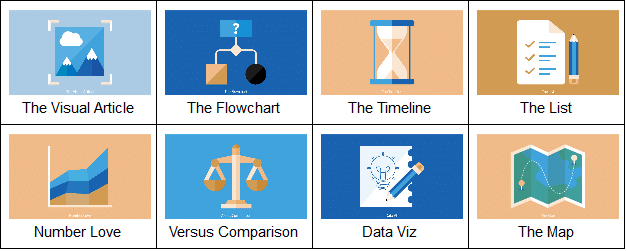
You should also use infographics to share your marketing research because you have so many types to choose from. This makes it simple to select a type that aligns with your studies and findings, as well as your visual identity.
3. Excellent Way to Go Viral
Every marketer wishes they could get their content to go viral. With an infographic, you greatly increase your chances of your message going viral through PR coverage.
The effectiveness of infographics derives from their ability to educate and convert customers, but they can only do this if they land in front of your audience. This is why social sharing is so important.
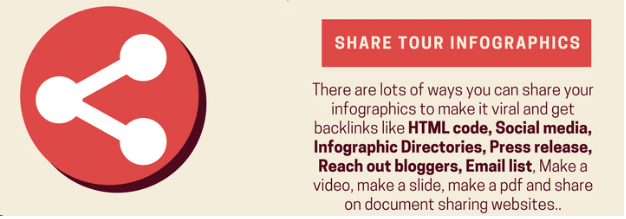
With infographics, it becomes incredibly simple for people to share them. All you have to do is include an embeddable code so they can publish it on their own site. And when they do, they can link back to your site, which is great for link building.
You’ll also want to include social sharing buttons that follow the person down the page as they are scrolling to see the infographic. At any point, they can click on the social sharing button of their choice to share it across social media. With this enhanced shareability potential comes the increased likelihood of your infographic going viral.
Can you imagine if you have an infographic that converts even 5% of its viewers and it goes viral in front of an audience of 5,000,000? That’s 250,000 new customers.
4. Easy to Optimize for SEO
Many researchers agree that infographics are an effective way to boost organic search engine rankings.
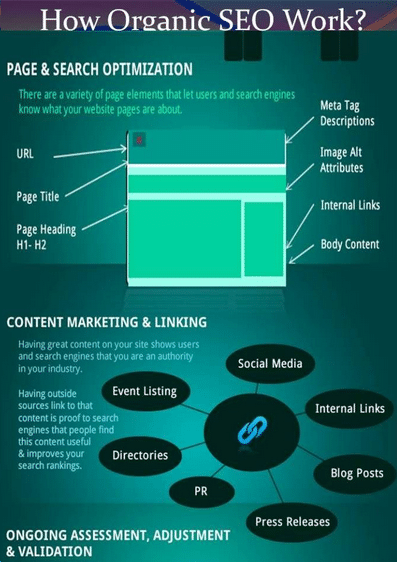
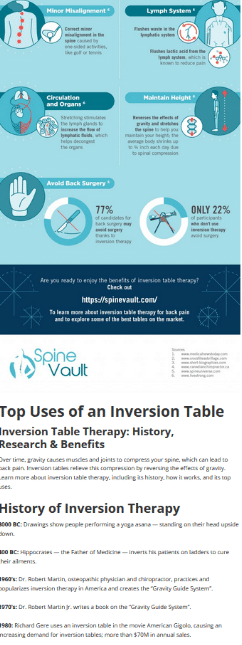
When you publish the infographic, make sure to include a text box below it that houses the content of the infographic, like in the example below. Notice how at the end of the infographic it goes straight into showing the infographic in text form.
Posting the content of the infographic below the infographic ensures that search engines will crawl the text. Since you’re using relevant keywords throughout the infographic, the search engines will pick up those keywords, and you’ll enjoy higher search engine rankings for increased visibility.
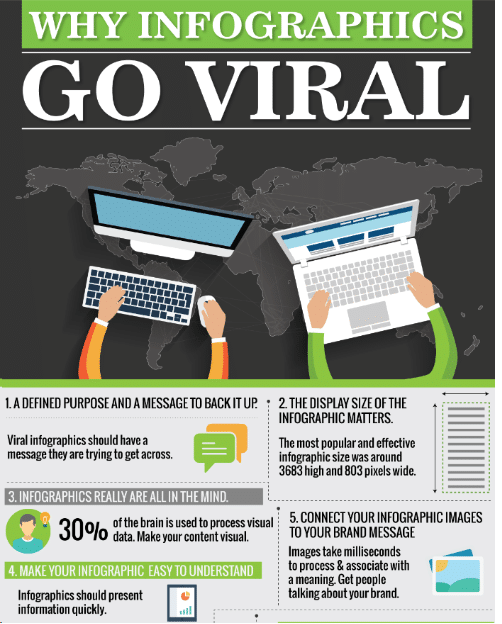
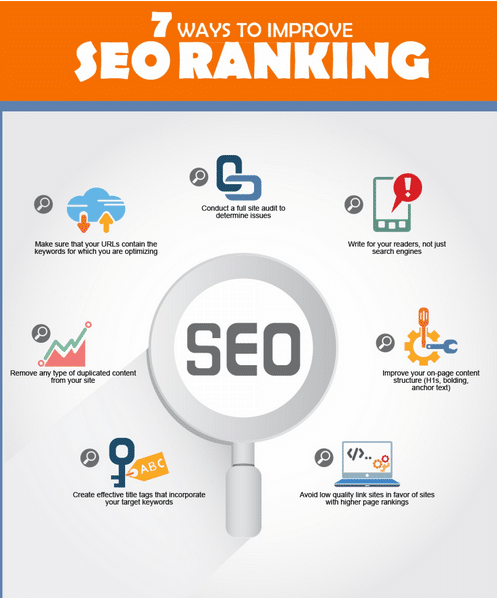
To further boost organic search engine rankings with an infographic, follow the tips shown below.
5. Great Asset for Multiple Marketing Methods
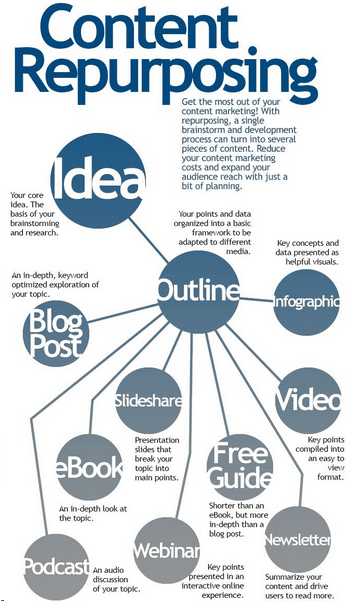
Lastly, research marketers need infographics because they can use them for multiple marketing purposes. You can easily take an infographic and use its content to create a blog post, explainer video, ebook, whiteboard animation, and even multiple types of print assets, including posters, brochures, leaflets, and more.
When you repurpose an infographic, your link building potential goes up greatly. You can secure links through the infographic itself or through a blog post, explainer video, social media post, and more.
Use Different Types of Data to Create an Effective Infographic
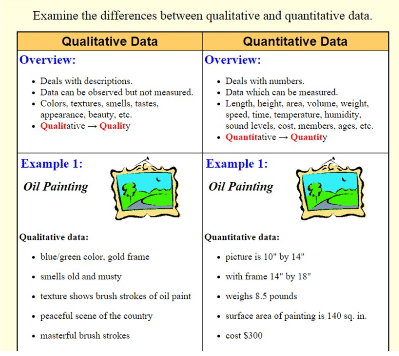
Publishing both qualitative and quantitative research findings in your infographic will help prove your point. It shows you came to the same conclusion using two research methods, which highlights you as an industry expert.
Use Your Buyer Persona
Always use your buyer persona when conducting your research. If your persona is a 30-year-old female who works from home, you don’t want to publish marketing research on 20-year-old athletes in college.
Use Customer Insights
It’s also wise to use client and customer insights as part of your research. This is because your audience will enjoy looking at quotes and stats represented by actual customers.
Use Authoritative Sites
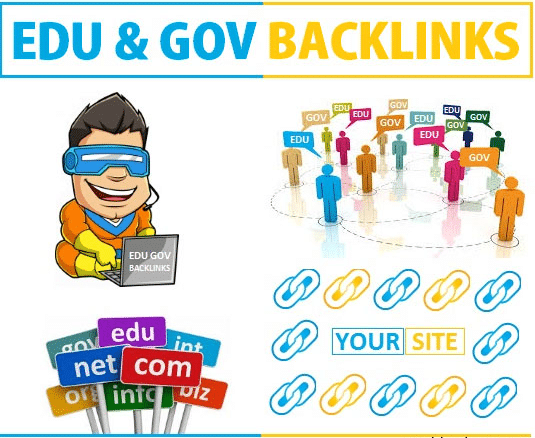
To boost the credibility of your brand in the eyes of your audience, only use authoritative sites to pull your information from. This includes .edu and .gov websites along with various data repositories like Statista and Pew Research.
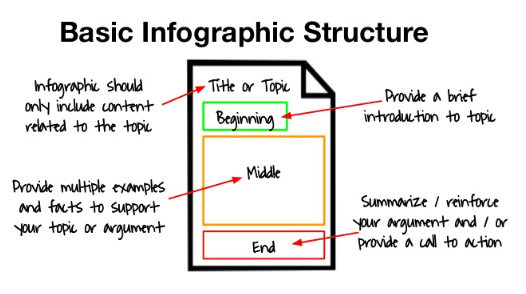
Create and Customize the Infographic
You can use a template to create your infographic or make one from scratch. It’s often better to create one from scratch because it gives you more customization options, which is crucial to standing apart from the millions of other infographics already on the web. It also makes it easier to align the infographic to complement your existing visual identity.
Choose the Topic Carefully
The topic of your infographic should answer a question that’s relevant to your audience. If you keep finding your clients or customers asking the same question over and over, this is probably a great topic to cover in an infographic. You could even do an infographic on the difference between qualitative and quantitative data and why it’s important.
Reach Out to Influencers
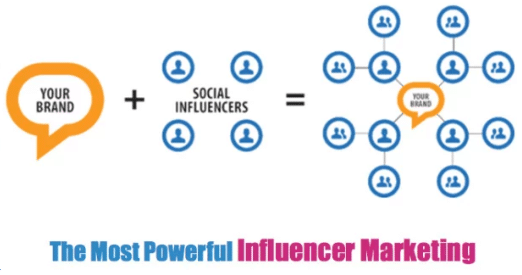
While you’re creating the infographic, reach out to influencers and other industry experts to see if they are willing to link back to the infographic once it’s published.
Give the Infographic a Unique URL
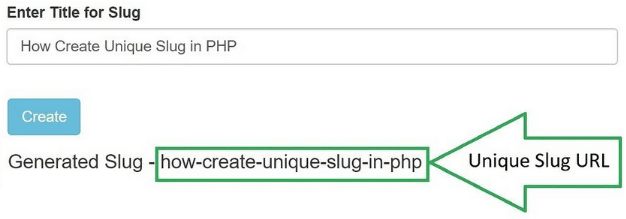
When posting the infographic on your site, make sure it sits on its own landing page. You can publish it under your blog, but make sure it has its own URL. This is essential for tracking the infographic’s performance.
Share the Infographic
Lastly, share, share, share! Share the infographic as much as you can across social media, through email, and any other outlets you can make use of. Any time someone comments on it, make sure to respond to their feedback or question.
Need help creating or sharing an infographic that highlights your latest marketing research? IGW just so happens to have a team of infographic marketing experts ready to assist you with all of your visual marketing needs. Contact us today to learn more about our infographic services.


