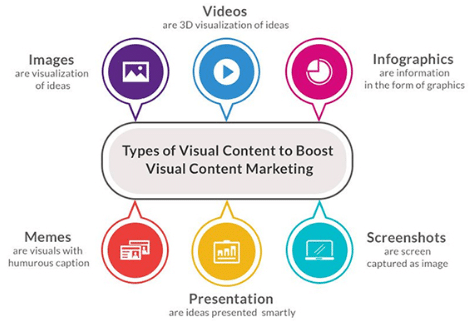
Never underestimate the importance of visual content. Your visual marketing influences your visual identity, and when used correctly, will increase brand awareness. Visual marketing is made up of so many elements that we could literally talk about them for years. From infographics to color psychology, these elements influence the opinions that consumers form about your brand.
There’s a good chance you’re already using visuals within your marketing. 80% of marketers use visuals in their social media marketing plans while 51% of B2B marketers label visual asset creation as their top priority. Many of them turn to visual content creators to assist them with creating visual assets.
Your Goal
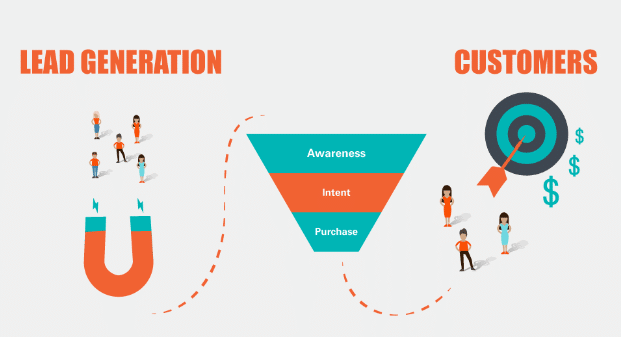
Your goal isn’t to create just any ol’ visual marketing campaign. The goal is to create one that converts leads into customers. By attracting new leads it will consistently add value to your site. To do this, you’ll need to track, measure and adjust your visual marketing strategy to improve its execution. You may even find that you need to partner with a visual content creator who specializes in visual marketing metrics.
How Does Visual Marketing Impact Visual Identity and Brand Awareness?
Your visual marketing efforts not only help you achieve higher conversions but also impact your visual identity and brand awareness.
What Is Visual Identity?
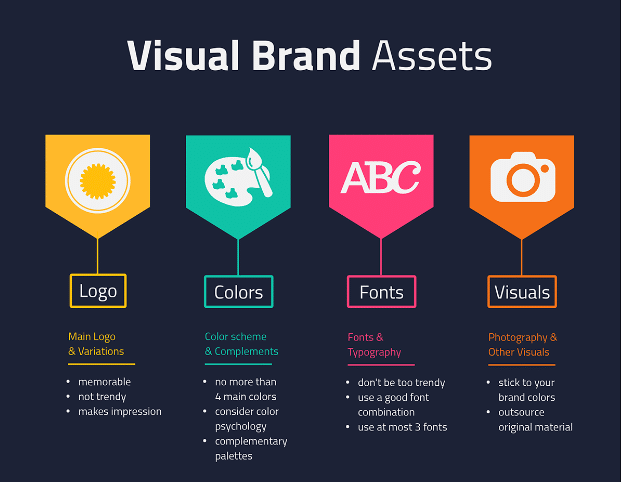
Your visual identity consists of the visual assets that you use for branding purposes. These assets evoke emotions and feelings from your audience to ensure they have a positive experience with your brand. Your visual identity consists of anything visual, including your logo, fonts, images, infographics, videos, whiteboard animations, and more.
Any time your brand communicates a message through the use of visuals, you are expanding your visual identity. All of your visual assets should focus on three core components:
- Overall message
- Values
- Promise of your brand
What Is a Brand?
Seth Godin, a well-known author, perfectly captured the definition of a brand when he said:
“A brand is the set of expectations, memories, stories, and relationships that, taken together, account for a consumer’s decision to choose one product or service over another. If the consumer (whether it’s a business, a buyer, a voter, or a donor) doesn’t pay a premium, make a selection, or spread the word, then no brand value exists for that consumer.”
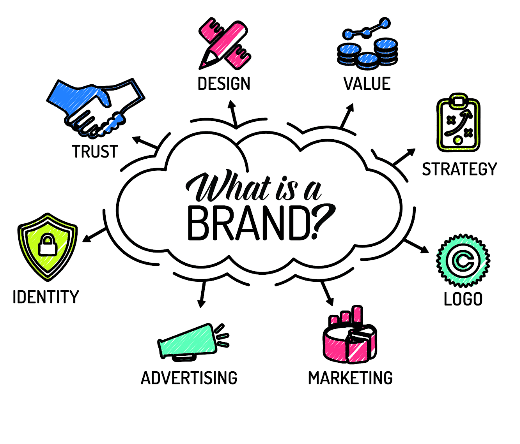
Your brand is made up of your visual identity along with many other elements, including your tone of voice, your strategies, the promises you make, and most importantly, the impression that you leave in the minds of consumers.
Now that you know the difference, you can start measuring and refining your visual marketing efforts to improve both your brand and visual identity.
Tools Needed to Measure Visual Marketing Efforts
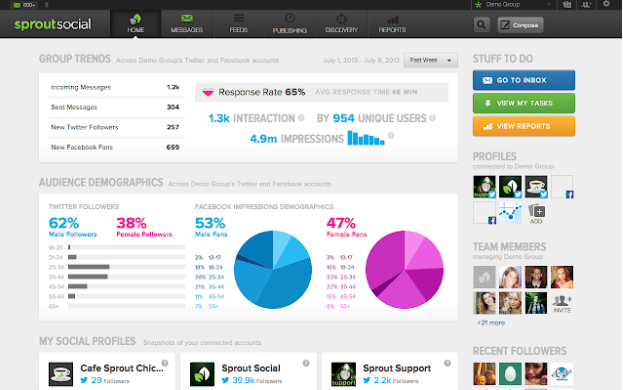
Google Analytics, social media tracking tools, and your CMS will help you measure your visual marketing efforts.
Google Analytics
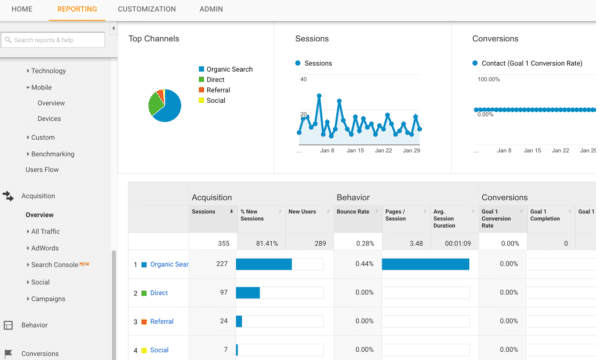
Google Analytics, which you can use for free, has a user-friendly dashboard that tells you how many unique visitors you’re getting each month, how much repeat traffic you’re getting, which pages people are viewing, and more.
With Google Analytics, you can easily tell if your pages with visual assets are performing better than the ones without visuals.
Google Analytics 360
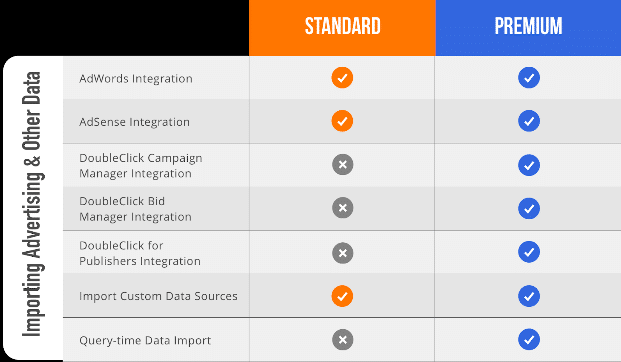
If you’re an enterprise, you can tap into Google Analytics’ more robust tracking platform through the premium version known as Google Analytics 360.
Access to the platform costs $150,000 a year and provides amazing tracking capabilities that you can use to achieve higher conversions and take your brand to the next level of success.
Features include faster data processing, access to unsampled data, lifts on data limitations, 50 custom variables, and more. You can get down to the nitty-gritty of measuring your visual marketing efforts with this version. To access Google Analytics 360, you’ll have to go through an authorized reseller.
Google Alerts
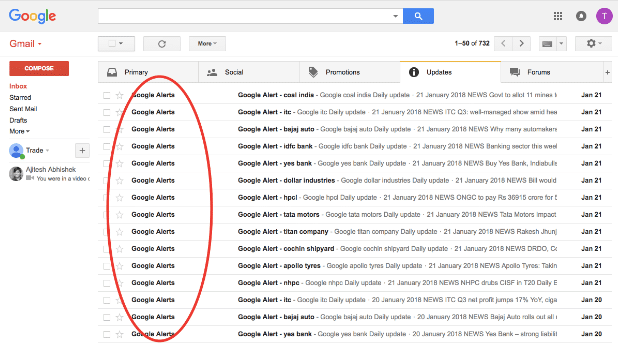
Google also provides a tool known as Google Alerts, which sends you a notification any time you’re mentioned on any of Google’s indexed pages. This gives you a simple way to listen to what’s being said about your brand on social media and blogs, in news stories, and more. It also helps you determine if your content with visuals is making its way around the web.
Social Media Tools
Your social media tracking tools will depend on the social media platforms you use. Each platform offers its own set of analytics. A quick online search will reveal a ton of other social media tracking tools that are created specifically for each platform.
| Social Media Platform | Tools |
| Union Metrics, Piqora, Simply Measured, Buffer, Quintly | |
| Buffer, Simply Measured, LikeAlyzer, Agorapulse, Quintly | |
| Buffer, Sprout Social, Quintly | |
| Tweriod, Buffer, Sprout Social, Quintly |
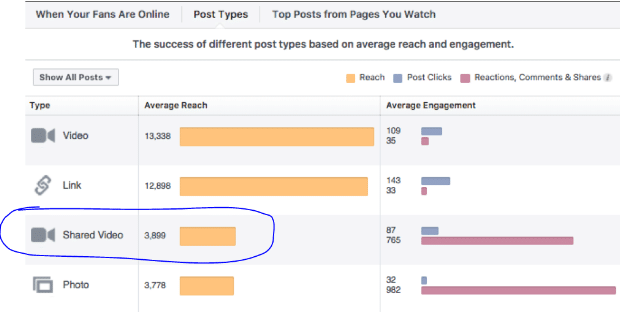
With social media tracking tools, you can perform lots of A/B testing to see which posts are receiving the most engagement. Say for example that you publish a whiteboard animation on a topic, and then two weeks later you post an explainer video on the same topic. Using analytics, you can measure each post’s performance. Your findings will help you adjust your visual marketing efforts accordingly.
CMS Tools
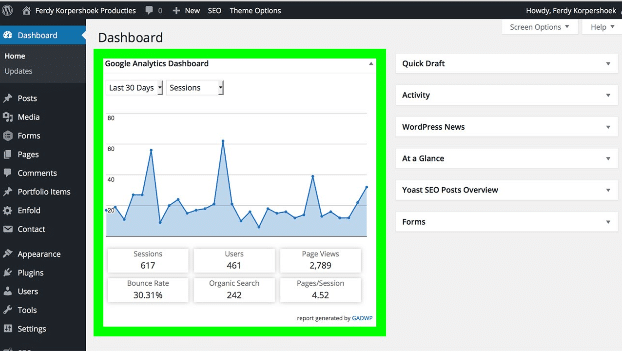
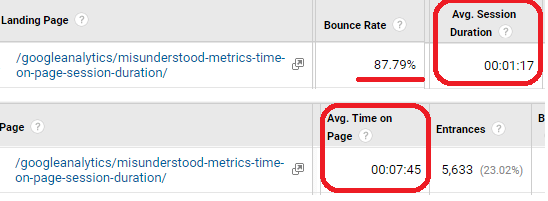
When we talk about your CMS — content management system — we’re referring to your website host, like WordPress, Weebly or Wix. All of these CMSs have analytics you can tap into to track your visual marketing efforts. Much like Google Analytics, you can track page views, bounce rate, average time on page, and more.
Measuring Visual Marketing Efforts
Understanding the importance of visual content is one thing. Using visuals to improve brand awareness and shape your visual identity is another thing altogether. Before you set out to create visual assets, you first need to determine your goal. Examples of goals include:
- Boost site traffic
- Reduce bounce rate
- Extend average time on page
Your goal not only influences the type of visual you need to create but also what to measure. If you post an explainer video on a landing page to extend average time on page, then you’ll look at your average time on page metric.
Measuring Videos
Measuring Videos
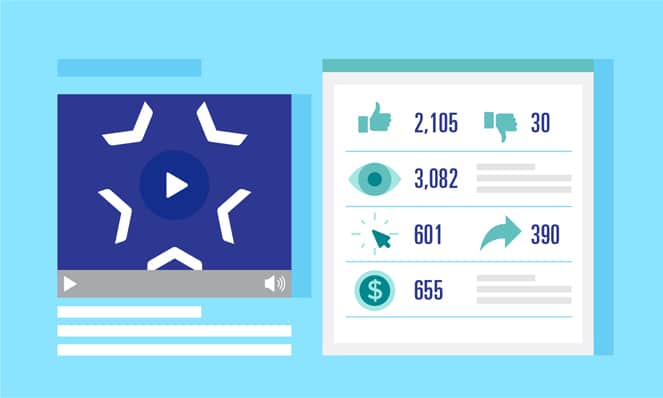
Creating a high-converting video marketing strategy starts with outlining your goal. From there you’ll know what topics to cover and which platforms to publish the videos on. Measuring your video marketing efforts requires taking a look at seven key metrics:
- View count
- Play rate
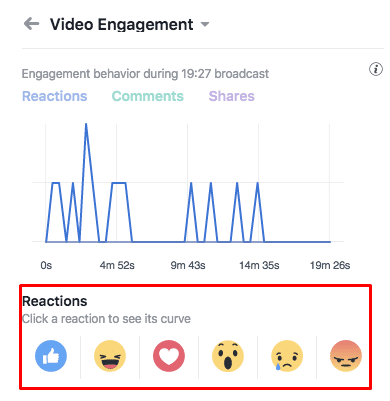
- Engagement
- Social sharing
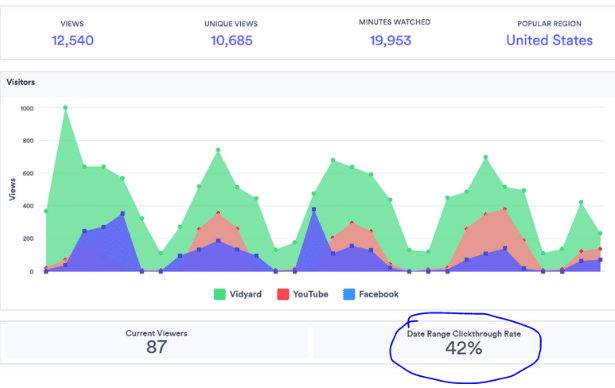
- Click-through rate
- Conversion rate
- Feedback
View Count
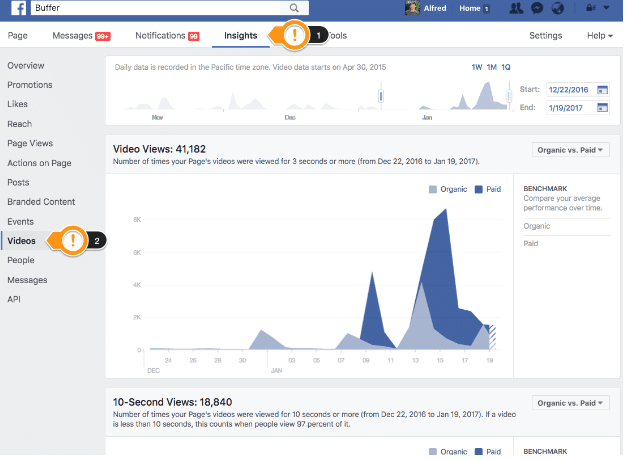
Don’t let your view count deceive you. Just because 20,000 people have watched a video doesn’t necessarily mean you’ve created a high-converting video marketing strategy.
If no one is sharing or following your CTA, the video’s conversion rate is going to be low. However, view count is still essential to improving brand awareness. To boost view count, follow these tips:
- Share the video on all social media platforms
- Share it with relevant influencers
- Pay to promote the video where your audience is at
Play Rate
Measuring the play rate gives you a good indication of how relevant the video is to the platform it’s posted on.
To increase play rate, you’ll need to:
- Increase the size of the video embed
- Choose a more engaging thumbnail
- Change the copy around the video
- Consider moving the video to a different page
Engagement Rate
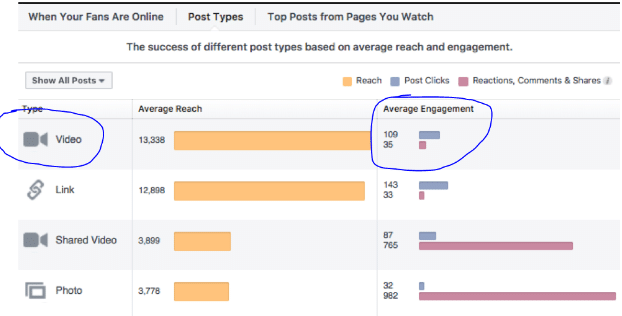
Engagement metrics tell you how many seconds or minutes of the video your viewers are watching. It gives you a good understanding of whether your audience is finishing the video as well as which point they click out of it. This shows you which parts of the video are the most engaging.
To improve the engagement rate and to enhance your overall video marketing strategy, always:
- Keep the video short
- Answer a specific question
- Figure out why your audience stops watching it after a certain point
Social Sharing
Social sharing metrics show you which platforms the video is performing the best on. You can use these metrics to help you determine where to focus your visual marketing efforts.
To improve social sharing:
- Ask viewers to share your video
- Make the video easy to share
- Ask influencers to share the video
Click-Through Rate
Click-through rates are essential to measuring a video’s conversion rate.
To improve a video’s click-through rate, you’ll need to:
- Position the CTA accordingly based on your engagement rate
- Make the CTA highly relevant to the video’s content
Conversion Rate
The conversion rate tells you how many leads you have acquired from the video. If a video has a high conversion rate, this a sign to create more videos on the same topic and share them across the same platform.
Measuring a video’s conversion rate is tricky. You’ll need to assess your attribution model to determine exactly what the conversion rate entails.
How many seconds of a video are counted toward the conversion of the viewer? Does the conversion rate only increase if watching the video was the last thing the viewer did before he converted? Or does the video account for a certain percentage of the attribution while still accounting for other steps the viewer took before the conversion took place?
To improve a video’s conversion rate:
- Make the video extremely relevant to your audience
- Don’t include anything but valuable content
- Place the video in an easy-to-find spot on your website
Feedback
Feedback metrics serve as a form of qualitative data that you can use to see how your audience is reacting to the video, if they’re reacting at all.
Measuring Infographics
There’s a lot that goes into creating an infographic. A lot of time, design, research, design, fact-checking, design, and more design. But once it’s published, the results are often amazing. This is why 42% of marketers agree that infographics are the best performing visual asset to leverage for visual marketing success.
To measure your infographic marketing efforts, you’ll want to take a look at its:
- Landing page analytics
- Value of backlinks
- Social shares
Landing Page Analytics
Always publish the infographic on its own landing page on your site. This gives you an easy way to measure your efforts.
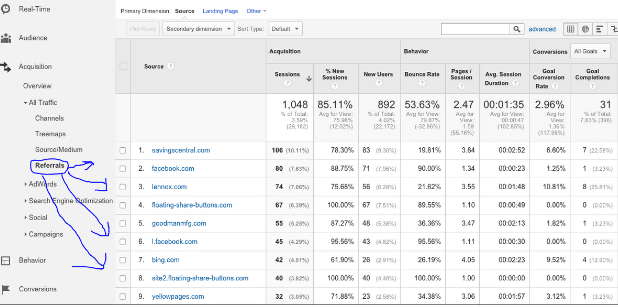
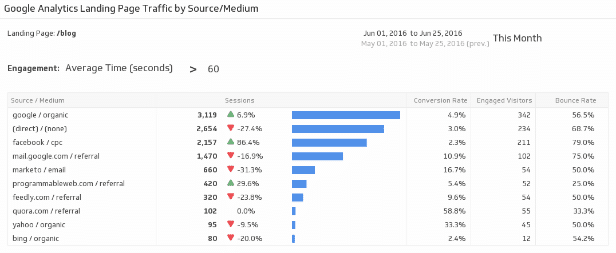
Can’t create a landing page for it? That’s fine, you can post it on your blog. Just make sure it has its own URL. Using Google’s analytics along with your CMS’s analytics, you can measure page views, referring sites, bounce rates, traffic patterns, and more.
Value of Backlinks
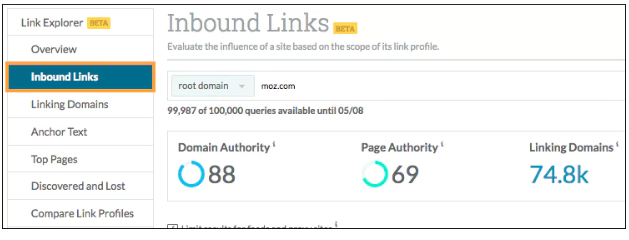
Use a tool like Moz Open Site Explorer to track inbound links. Take a look at where they’re coming from and the sources’ domain authorities.
Social Shares
People commonly believe that backlinks stemming from social media sites have no value, but this isn’t entirely true. It’s crucial to track an infographic’s social sharing rate because it allows you to see how well it’s performing on different platforms. You may find that infographics covering a specific topic perform better on certain social media sites. Then, you can refine your infographic marketing strategy accordingly.
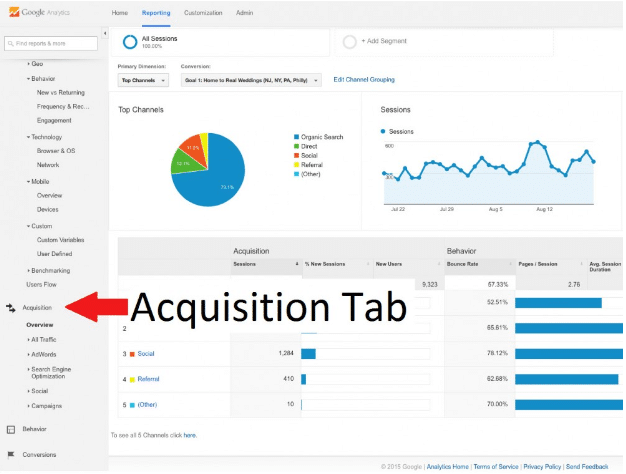
Google Analytics makes it simple to see when you have received a backlink from a social media site. Simply go to “Acquisition” under the “All Campaigns” tab.
If you want to use UTM parameters to track social media backlinks, you’ll need to shorten the infographic’s URL using Bit.ly. However, keep in mind that this might impact your branding negatively because people tend to look unfavorably upon Bit.ly links.
How to Increase Conversion Rates With a Visual Content Creator
If your goal is any of the following, visual marketing is THE solution:
- Promote your brand clearly
- Explain a product or service in an easy-to-understand manner
- Explain a strategy to your internal team
- Generate more conversions
- Achieve higher search engine rankings
- Expand social media presence
- Increase revenue
- Connect with your audience
- Engage your audience
- Build trust
- Create customer loyalty
The list above could go on and on.
When you alter your marketing plan to include visuals, you not only strengthen existing customer relationships, but also form new ones. Just as your impression about other brands is based on their marketing, your audience’s impression of your brand is based on your marketing.
Consumers turn to the internet to search for information about the problems they are facing. As they’re researching their problems, they are hoping to find a solutions. Visual marketing allows you to not only tell them about a solution but show them it too.
Visual marketing works for so much more than acquiring new customers. You can use it across the entire customer journey.
Imagine having a section on your website dedicated to FAQs that’s jam-packed with visuals that outline specific answers to each question. Not only are you reducing customer inquiries and saving resources, you’re also providing an optimal user experience. You are making it simple for your audience to find the answers they are looking for. This is what true SEO is all about, and it’s what drives conversions and increases revenue.
If you’re ready to increase conversions with visual marketing, it starts with measuring your existing efforts. Use our tips outlined in this article to measure the success of your video and infographic visual assets. Then use your findings to refine your strategy and increase conversions. If you need help along the way, don’t hesitate to contact our team of visual content creators who excel in helping brands just like yours succeed with visual marketing.
Whether you’re looking for a top B2B marketing agency, or a killer B2C marketing company, look no further than IGW.


