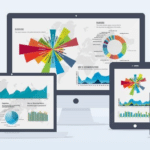
In a world full of mobile devices and online shopping, data is more readily accessible than it ever has been. As a marketer, you likely understand the value of data-driven marketing.
When used strategically, you can use customer data to refine your content marketing efforts and improve your marketing ROI. Being able to see through this data is key to understanding where a business is going wrong, how to move a business forward, and how to forecast business operations. Additionally, it is only half the battle to understand the data and to know your audience. The next step will be making a tailored marketing plan for that audience via various channels and content.
In this post, we’re going to explore the ins and outs of data-driven marketing and how you can use it to map out a marketing campaign. We’ll also learn how data analytics can help a visual marketing strategy better target an audience and become more effective in reaching that audience with multimedia content.
What Is Data-Driven Marketing?
The MIT CISR Data Board defines a data strategy as a central, integrated concept that articulates how data will enable and inspire business strategy. With an effective data-driven marketing strategy in place, you can answer the following five questions:
- How does your brand intend to use the data?
- How will your brand move forward with its data-driven marketing strategy?
- How will your brand drive data adoption?
- When will your brand implement your data adoption strategies?
- How will your brand monetize its data?
As your organization matures, you will also mature in how you collect and use data. You will get better at extracting insights from your data, allowing you to acquire meaningful use of the data to improve your marketing methods as well as other aspects of your company.
Marketing Data Analysis: Building Blocks of Your Strategy
A strong data analytics strategy has several elements that provide for a comprehensive look at a business’s operation.
Identify
You must have a way to identify data regardless if it is structured or not. You can analyze the data all you want, but it needs to have a name along with a defined format. This is why you must use consistent data element naming conventions.
Store
You need a place to store your data. Ideally, this will be in some type of data management system. Because you will likely have various forms of data management systems, it’s important that each system integrates with one another. This makes it much easier to thoroughly analyze all of the data together to gain the most valuable insights.
Provision
You must have a way to provision (package) the data, as this makes it simpler to reuse and share the data as needed. Along with packaging the data, you must create provisioning rules and guidelines to keep the data safe and secure.
Process
You need a way to move and combine your data so that you can achieve a unified data view. Data visualization techniques prove beneficial when you’re processing data, and they can prompt better business decisions by putting data into easily digestible visual pictures or videos.
Govern
You should implement information policies and share them on a regular basis to ensure all employees have a thorough understanding of effective data usage.
Turning Your Data Into Actionable Marketing Insights
A strong data strategy can provide a business with direction as long as data processing is done correctly. This is why you should try various data processing techniques. With the right ones, business owners and employees can get a clearer picture of their audience, marketing trends and more.
Recognize Patterns
Always choose data processing techniques that make it easy to recognize patterns. It’s in these patterns that you can start to learn important factors about your audience. Let’s say, for example, you use a data processing technique that reveals the majority of your email marketing responses are garnered on Tuesday afternoons. With this type of knowledge, you can refine your email marketing campaign accordingly.
Data Visualization
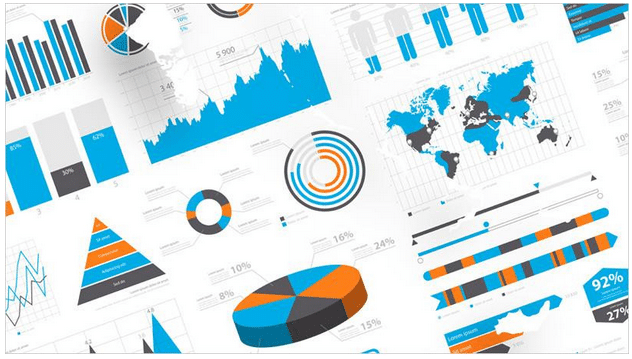
Data visualization is key to building an effective data-driven marketing strategy. It is through various types of data visualization that you can make sense out of your data. More importantly, data visualization helps you share your insights with investors, customers, employees, and more through data storytelling. Some of the top data visualization techniques include:
- Line charts
- Column charts
- Scatter charts
- Bubble charts
- Pie charts
- Pivot tables
There are several really great data visualization software programs you can leverage to help with all of your data visualization efforts. You can use these programs to present information to your customers with all the context they need about your business or a specific product. Data visualization makes it easy to tell your brand’s story clearly and concisely even while presenting a ton of statistical data.
Are you ready to use a data-driven marketing strategy to generate leads, drive conversions, and improve your marketing ROI? If so, contact IGW today. Working alongside a visual marketing agency can help you compile the data using various data visualization techniques.

