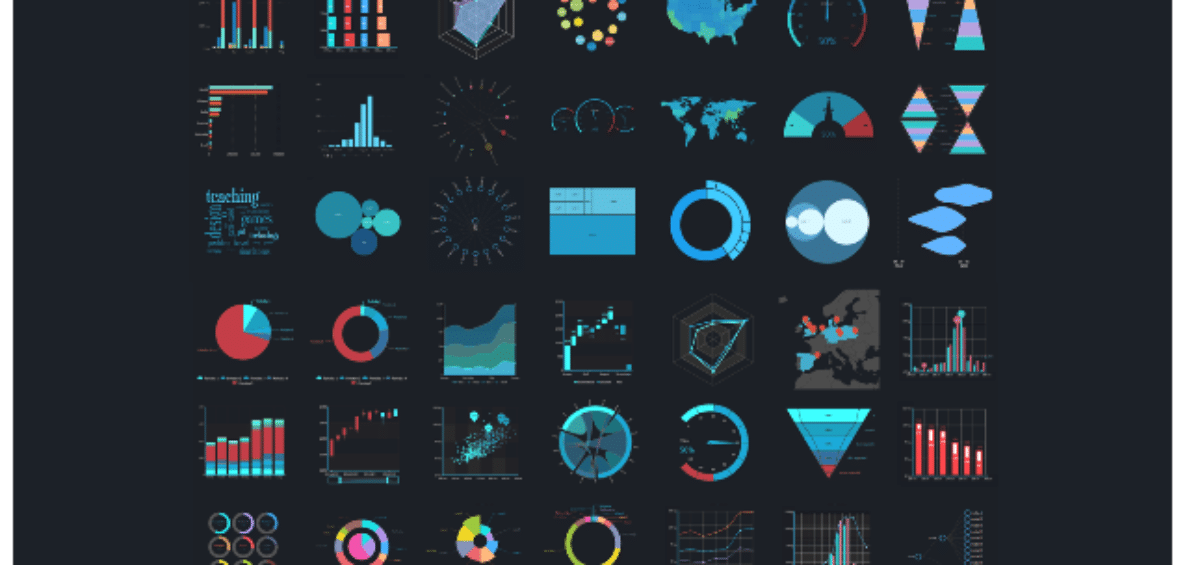
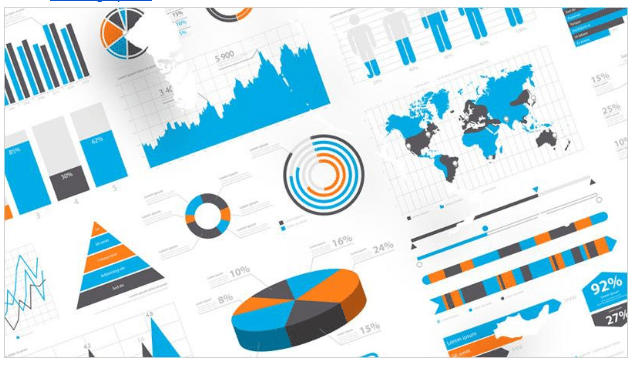
Data visualization, commonly referred to as visual storytelling, helps brands generate traffic and achieve higher conversions. No doubt about it, consumers have a high preference for visual content, which makes data viz and data storytelling essential elements to any content marketing strategy. Keep reading to learn more about the importance of data visualization, or check out this post on various data visualization tools you can use to leverage this form of visual marketing to your advantage.
What Is Data Visualization?
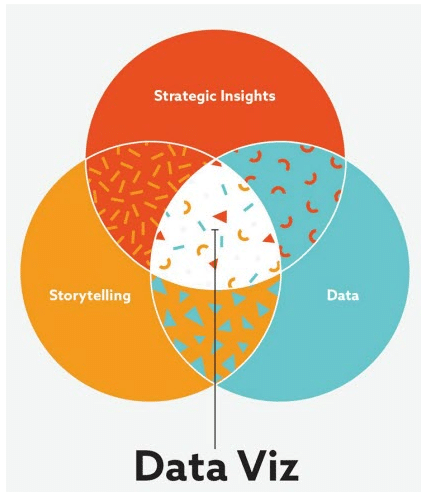
Data visualization consists of presenting data or information in pictorial or graphical form. It is especially helpful in communicating complex topics and massive amounts of data. You can use data visualization for a number of purposes, including to pinpoint patterns in data and to discover hidden trends and facts. In an era that is constantly swimming through waves of big data, researchers and marketers alike use data visualization tools to identify strategic insights and make informed, data-driven decisions.
Understanding the Importance of Data Visualization
When we look at something, our eyes are automatically drawn to graphics, including colors and patterns. We instantly recognize purple from green and triangles from circles. Everything from advertisements on Facebook to TVs and movies appeals to us on a visual basis.
Marketers use data visualization tools and techniques to grab the attention of their audiences. More importantly, they leverage data visualization to guide a user’s eyes toward a call to action.
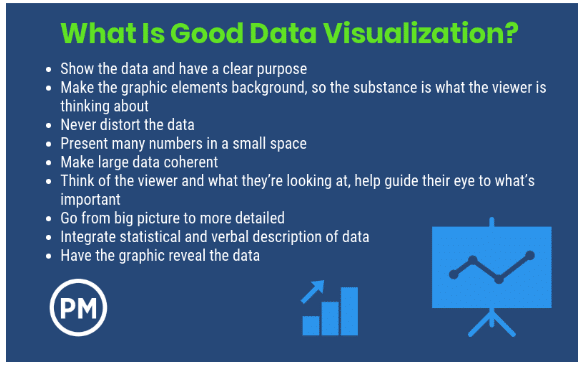
Ultimately, data visualization allows marketers to tell stories with an intended purpose. Marketers can curate data so that it’s easy to digest and understand while highlighting pertinent pieces of information. Effective data visualization not only tells a story but ensures the viewer isn’t distracted by any unnecessary elements.
Is Data Storytelling the Same Thing as Data Visualization?
Although data visualization uses data to tell a story, it is not, in fact, the same thing as data storytelling. However, the two are equally important, and marketers should utilize both within their content marketing efforts.
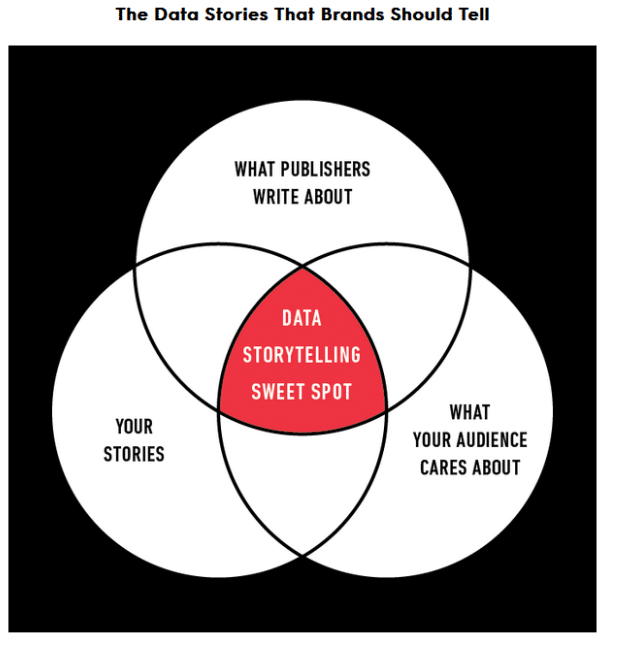
Data storytelling blends hard data with human communication in a way that creates a compelling narrative backed by data. Many brands fail to use data storytelling to their full advantage.
Businesses, whether they realize it or not, are sitting on gold mines of data. Unfortunately, much of this data never makes its way into the hands of marketing managers. And even when marketing managers do get their hands on it, they are often ill-equipped to analyze the data and unearth meaningful stories.
Benefits of Data Visualization and Data Storytelling
As a marketer, you must use strategic planning to ensure you have access to data analytics. You must also find a way to blend your data storytelling and data visualization efforts. When you do, you gain an array of benefits.
Provide Value to Your Audience
Your audience wants useful information. Let’s pretend you’re a distributor of hard hats, so you create a blog post on the benefits of wearing this type of safety equipment. First of all, most anyone is well aware of the benefits of wearing a hard hat, and they don’t need you to reiterate what they already know. What they want is for you to tell them something they don’t know, like the number of injuries hard hats prevent each year. More importantly, how many injuries your brand of hard hats has prevented during the last year.
When you provide meaningful information, the human brain automatically associates your brand as being authoritative, especially when you present the information in a visual format. Your audience will think to themselves, “If this brand has the data and resources to tell me how many injuries their hard hats prevent each year, then this must be a brand that is serious about saving lives.”
Data alone is useless. It’s only when you use graphics and storytelling to bring data to life and find hidden insights that you can increase conversions. Data visualization and data storytelling do just that — they allow you to analyze your data and present it in narrative form, and in doing so, help you move the audience through the sales funnel.
Great Way to Go Viral
At the heart of getting pieces to go viral is the ability to craft unique stories. When you use data and analytics, you can create these stories, especially when using internal data.
Internal data is data that no other brand has access to, meaning your story will be completely unique. You can use the data to shed light on a topic from a unique angle or perspective. When you put an interesting spin on a topic that’s already been covered by numerous other brands, you position yourself to gain coverage from an array of high-profile publications. This allows you to elevate your brand to new audiences by securing backlinks from sites that have high domain authority. The more backlinks you get through sites with high domain authority, the higher search engine rankings you can achieve, which is essential to expanding brand awareness.
Versatility at its Finest
Another notable reason to use data visualization and data storytelling is because of their versatility. You can communicate the insights you acquire from data stories via multiple data visualization types. Some of the most popular data visualization types include:
- Infographics
- Articles
- Case studies
- Presentations
- White papers
- Videos
- Reports
- Motion graphics
Think about it. For every piece of data visualization that you create, you literally have eight-plus formats to share it in. You can devote a whole month of content sharing to a single story. This gives you a great way to use data visualization tools to come up with plenty of content so that you’re publishing new pieces on a regular basis.
Now that you understand the importance of data visualization, it’s time to check out various data visualization techniques you can use. There’s a lot that goes into creating effective data visualization content pieces. If you need help, make sure to reach out to IGW. We have a team of expert graphic designers who meet all of your data visualization needs.

