Visual organization is key to achieving maximum productivity in the office. According to Psychologydictionary.org, “Charts and drawings are common examples of visual organization tools to help present data in a way that is well-ordered and presentable to the audience.”
Before we dive deep into various types of visual communication and organization, let’s first take a look at why visual organization matters. As a marketer, understanding visual organization is essential to all of your visual marketing efforts.
Why Does Visual Organization Matter in the Workplace?
Visual organization in the workplace is important because workers only remember about 30% of what they read and 10% of what they hear. And out of an eight-hour day, productivity levels are only at an acceptable level for about 33% of the time. Each month, most workers spend an average of 18% of their time (31 hours) in unproductive meetings.
What if there was a way to boost productivity? Well, there is, and it starts with creating a visual strategy.
Humans love visuals. We are visual learners and have the ability to make sense of a visual in less than one-tenth of a second. With visual organization , you can increase information retention by 50% and break down common language barriers. To show how widespread this issue is, consider that approximately 90% of businesses face language barrier challenges.
Visuals improve comprehension by 50% and boost motivation by 43%. When it comes to sharing a complex message, you definitely want to present the information in a visual, such as an infographic. 90% of information transmitted to the human brain is visual, so it only makes sense to share messages via visuals.
How Does This Relate to Your Visual Marketing Efforts?
With a solid visual organization plan in place, you can generate positive results. And with positive results coming from the marketing department, this will translate into higher levels of productivity. That, in turn, results in better customer service and retention.
Imagine your marketing department having a better understanding of your target audience because you present data in the form of visuals. With a better understanding of your target audience, your marketing department can refine its strategies to better reach leads who are most likely to convert.
Or, imagine having a ton of data on your latest video marketing campaign. The data has insightful metrics that indicate which marketing methods are working and which ones aren’t. However, unless you organize the data and present it in an easy-to-understand manner, the data is useless. With visual organization, you can easily demonstrate which video marketing methods are achieving the highest ROI.
Now that you understand why you should use visual organization in the marketing department, let’s take a look at different types of visual communication you can use.
Types of Visual Communication and Organization
A strategic visual organization plan can increase worker productivity by 25%. You will need to take advantage of various visual tools to implement your plan. Many businesses choose to lean on a visual marketing agency like IGW to help them create data-backed visuals. Some also use data dashboards to create stunning visuals that they use for internal and external visual marketing purposes.
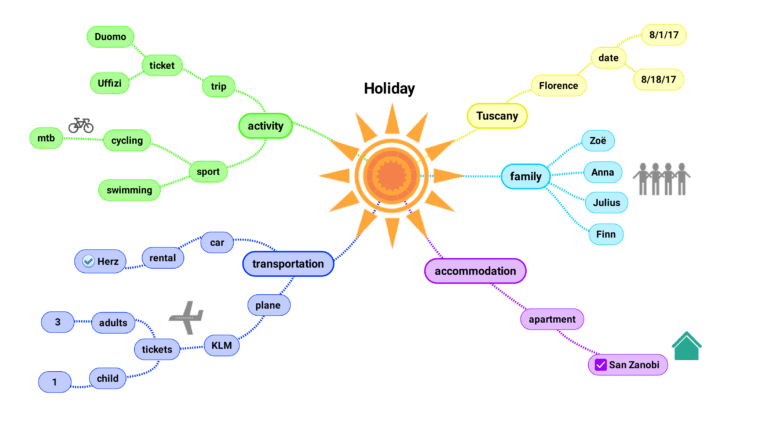
Mind Maps
Flowcharts
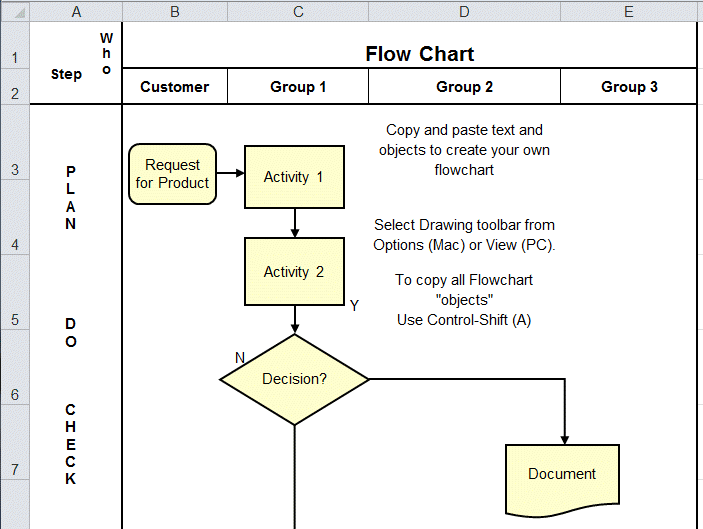
When your goal is to map the flow of a process in a visual way, you’ll definitely want to use a flowchart. You can easily find solutions to problems with a flowchart, much like you can with a decision tree. Any time you need to make a strategic marketing decision, a flowchart will be immensely valuable. This type of visual organization is also beneficial for mapping out plans or projects.
Gantt Charts
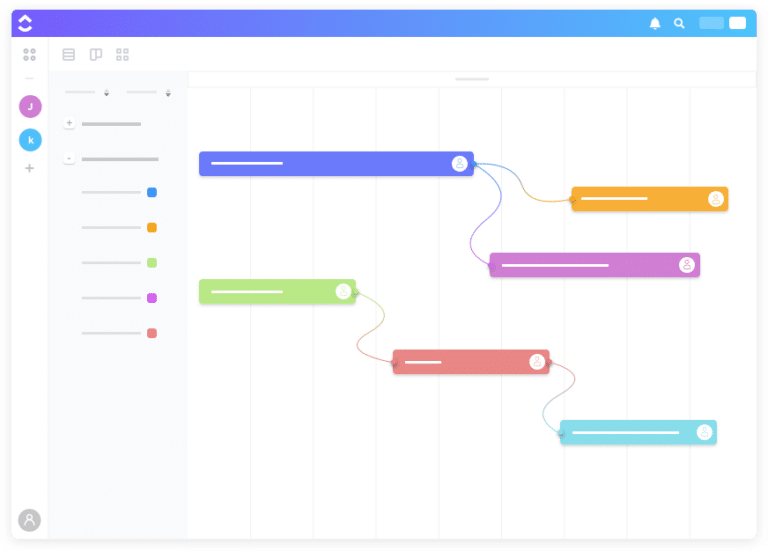
A Gantt chart can help you define the timeline of a project in a visual manner. It makes planning projects very easy and simplifies tracking project results. If you notice communication barriers between workers, a Gantt chart can help you break this barrier by enhancing communication between project members. Gantt charts also work well for helping you accurately allocate marketing project resources.
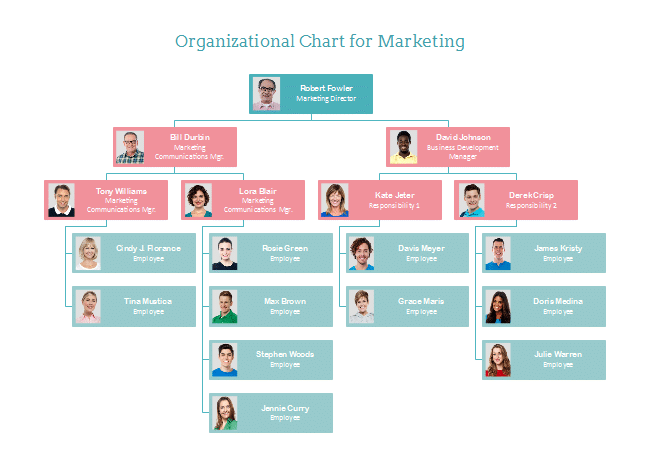
Organizational Charts
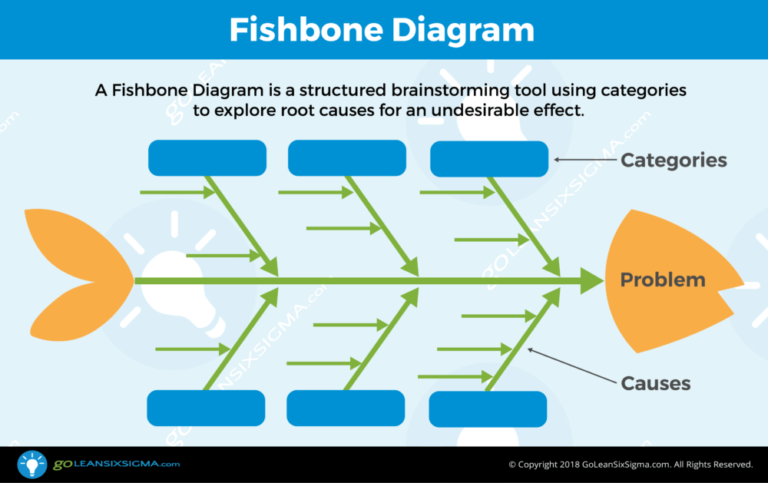
Fishbone Diagram
Final Thoughts
Are you ready to use visual organization in the marketing department to increase productivity? If so, IGW is here to help. We have graphic design experts who excel in creating all types of visuals. We can even work within your data dashboards to bring your data to life. With our visual marketing expertise, we can help you make smarter marketing decisions.


